
INDIAN RAILWAYS ANALYSIS
OBJECTIVE
Analyzing Indian railways dataset and finding trends in schedule and the trains with stations all over India
Quick Links :-
Tools Used :-
Pandas, Matplotlib, Seaborn, PowerBI
INTRODUCTION
Indian Railways is a statutory body under the ownership of the Ministry of Railways of the Government of India that operates India's national railway system
Why this Dataset:- The sample data typically includes collections for trains, schedules, and stations. Also, it includes location data in geojson format..
Overall Goal:-
Build a comprehensive dashboard using PowerBI, combining various visualizations to present key insights from the analysis.
EXPLORATION
The JSON file is explored and converted to a geopandas data frame as it contains location data.
The stations have point geometry and the trains have linestring geometry.
Also to show the boundaries a shp file is used.
While cleaning it can be seen that a lot of state is missing in the stations file. So I had to do a spatial join to occupy the null states.
VISUALISATION
The dashboard is divided into 5 parts
Overview
This dashboard provides an overview of the data with trains by zone, and all the scheduled trains with a slicer by state.
It also has a map with shades depending on the number of trains.

It has 4 KPIs:
-
Total Trains
-
Total Stations
-
Total Schedules
-
Avg. Distance


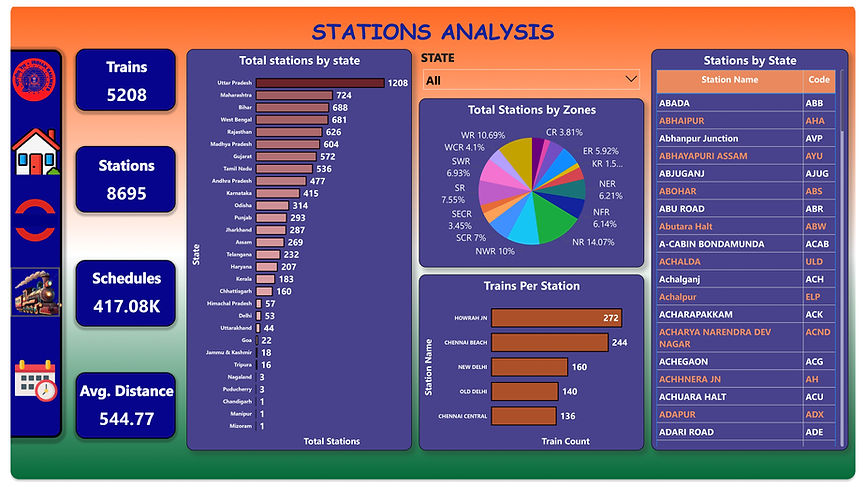
Station Data
This dashboard analyses the different aspects of Stations.
Schedule Data
This dashboard analyses the aspects of schedules with arrival and departure distribution.

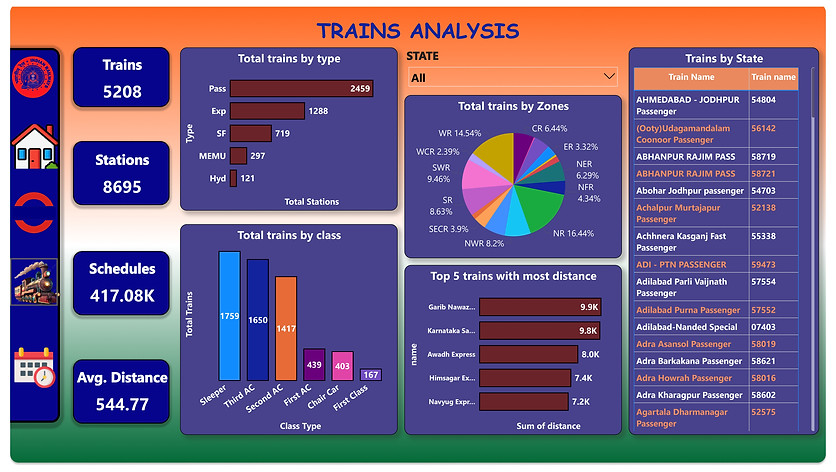
Train Data
This dashboard analyses the aspects of Trains such as train types , coaches etc.
Observation

WHAT I LEARNED
-
How to use geopandas dataframe.
-
Use of Shp and geojson files
Download the dataset from