
AIRBNB DATA ANALYSIS
OBJECTIVE
Analyze Airbnb data using MongoDB Atlas, perform data cleaning and preparation, develop interactive geospatial visualizations, and create dynamic plots to gain insights into pricing variations, availability patterns, and location-based trends.
Quick Links :-
Tools Used :-
Pandas, Matplotlib, Seaborn, Tableau
INTRODUCTION
Airbnb, Inc. is an American company operating an online marketplace for short- and long-term homestays and experiences. The company acts as a broker and charges a commission from each booking. The company was founded in 2008 by Brian Chesky, Nathan Blecharczyk, and Joe Gebbia.
Why this Dataset:- The sample data typically includes collections for listings, reviews, and users. Also, it includes property location data.
Overall Goal:-
Build a comprehensive dashboard using Tableau, combining various visualizations to present key insights from the analysis.
EXPLORATION
The JSON file is explored and it is inserted in MongoDB atlas. the data is then fetched from MongoDB and saved to CSV file for later use.
The data is also cleaned to remove null values and change some crucial data types.
A sample image of a single document is given below:

VISUALISATION
The dashboard is divided into 4 parts
Geographical data
This dashboard shows the geographical location of the Airbnb properties. It is color coded bas on the number of properties.
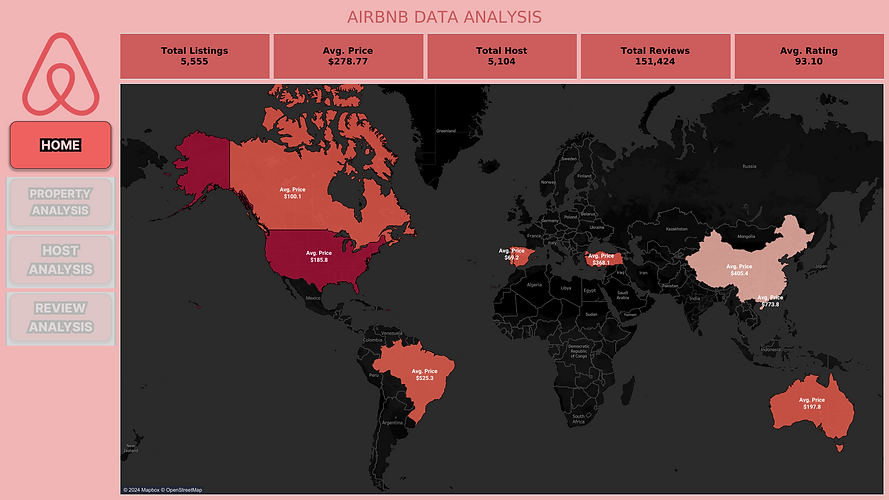
It has 5 KPIs:
-
Total listings
-
Average Price
-
Total Host
-
Total Reviews
-
Average Rating

Property Data
This dashboard analyses the different aspects of properties.
It also has 1 slicers: Country

Host Data
This dashboard analyses the aspects of Hosts with Avg Price and reviews
It also has 3 slicers: Country, Superhost and is verified

Reviews and Amenities
This dashboard analyses the aspect of Review, Review Scres and Amenities
It also has 1 slicer: Country

WHAT I LEARNED
-
How to create new Parameter and calculated Field
-
How to create a mongoDb cluster.
-
Fetching data from MongoDB using python.
Download the dataset from